
Your Keyword Rankings and Visibility Report for 2026
Most advice about a keyword rankings and visibility report is outdated. It still assumes the report's job is to tell you whether a keyword moved from one position to another in Google.
That's too narrow now.
A useful report has to answer a harder question: where is your brand gaining or losing visibility across search surfaces, prompt types, geographies, and user intent? If you only track blue-link rankings, you can miss a more serious shift. A page can hold steady in traditional search while your brand disappears from AI answers, loses featured snippet exposure, or weakens in the specific markets that drive pipeline.
The reporting mistake isn't just old tooling. It's old framing. Search visibility is no longer one metric, one engine, or one audience.
Table of Contents
- Why Your Old Keyword Report Is Incomplete
- Defining Your Modern Visibility KPIs
- Building Your Hybrid Report Template
- Customizing the Report for Different Stakeholders
- Interpreting the Data and Taking Action
- Automating and Distributing Your Report
- Frequently Asked Questions
Why Your Old Keyword Report Is Incomplete
A traditional keyword report usually answers the wrong question. It tells you what rank changed. It doesn't tell you which segment lost visibility, which intent bucket weakened, which geography slipped, or which terms fell out of meaningful range entirely.
That gap matters because modern visibility isn't a single-position metric. Advanced Web Ranking's analysis makes the point clearly: the more useful question isn't “what rank changed?” but “which ranking-band segment lost ground, and which keywords fell out of top 100 entirely,” while also breaking out topic clusters, geography, and intent in the analysis keyword ranking distribution workflow.
Rankings alone hide business risk
If your report shows that average positions stayed stable, that can sound fine. It often isn't.
A portfolio can look healthy at the headline level while high-value commercial terms drift downward, informational terms improve without driving revenue, or one country weakens while another masks the loss. Add AI answer surfaces to that mix and the blind spot gets larger. People don't always visit a ranked page now. Sometimes they get the answer before the click.
Practical rule: If your report can't isolate changes by ranking band, intent, geography, and topic cluster, it can't diagnose the cause of visibility loss.
The same problem exists inside analytics. Many teams still try to interpret organic performance with incomplete query data, then fill the gaps with assumptions. If your search reporting is already constrained by missing keyword data, a practical guide to 'not provided' analytics is worth reviewing before you redesign the report. It helps clarify what you can infer responsibly and what you can't.
Visibility now spans multiple surfaces
A page can rank. A brand can still lose.
That happens when competitors capture featured snippets, local packs, AI-generated answers, or citation share in prompts related to your category. Traditional rank tracking remains useful, but only as one layer. The report has to connect ranking movement with actual exposure and business relevance.
Use this test. If your current keyword rankings and visibility report can't answer these questions, it's incomplete:
- Which keyword groups lost exposure by intent? Informational decline and commercial decline are not the same problem.
- Which geographies changed first? National stability can hide regional weakness.
- Which topics are weakening even when average rank looks flat? Distribution matters more than a single average.
- Which channels still show you and which don't? Traditional search and AI answers now need separate visibility views.
The old report was built for monitoring positions. The modern one is built for diagnosing presence.
Defining Your Modern Visibility KPIs
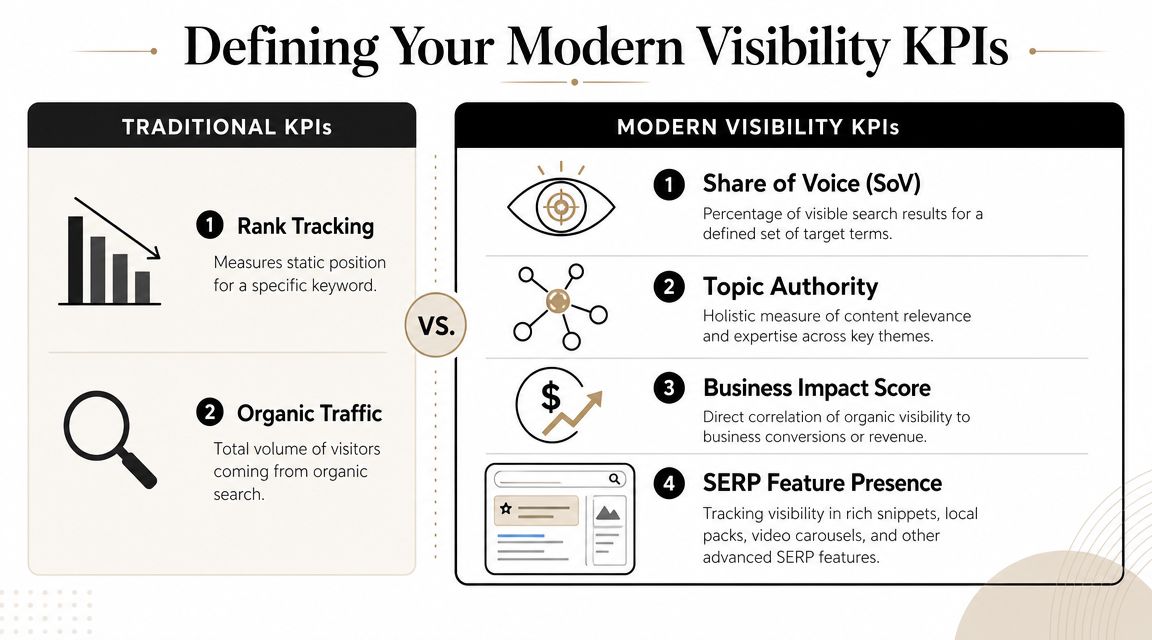
A good keyword rankings and visibility report now behaves more like a business dashboard than an SEO worksheet. Modern reporting commonly includes keyword rankings, organic traffic, CTR, share of voice, AI mentions, answer share, and LLM citation tracking, reflecting a broader view of search presence rather than position alone, as described in this overview of the modern keyword rankings and visibility report.
What still belongs in the report
Don't overcorrect and throw out classic SEO metrics. They still matter because they tell you whether your owned assets are discoverable in conventional search environments.
Use the traditional layer to track:
| Metric Category | Traditional KPI (SEO) | Modern KPI (SEO + AI) |
|---|---|---|
| Positioning | Exact keyword rank | Ranking distribution by band, plus answer presence by prompt set |
| Traffic | Organic sessions | Organic sessions plus AI-driven visits and citation-assisted discovery |
| Click behavior | CTR from search listings | CTR plus answer share and brand mention visibility |
| Competition | Competitor rank overlap | Share of voice across search and AI surfaces |
| Coverage | Indexed pages and ranking terms | Coverage by topic cluster, geography, intent, and model/channel |
| Search features | Basic SERP ownership | Featured snippets, local packs, AI mentions, and citation source share |
The key shift is that rank tracking becomes a component, not the headline.
For share of voice, many teams still need a better operational definition. This explainer on SEO share of voice is useful because it grounds the metric in competitive search visibility rather than vanity ranking wins. That's the framing you want in the report.
What modern visibility adds
The report should also include metrics that reflect how people encounter brands in AI-mediated journeys. These aren't replacements for SEO metrics. They're the missing half.
A practical KPI set looks like this:
- AI mentions: Whether your brand appears in responses for tracked prompts.
- Answer share: How often your brand appears relative to competitors in the answer set.
- Citation source share: Which domains or pages models cite when discussing your category.
- Prompt visibility by intent: Whether you appear for discovery, comparison, evaluation, and purchase-oriented prompts.
- Geographic visibility: Whether model answers vary by market or country.
- Topic-cluster strength: Whether your brand appears consistently across a theme, not just a single prompt.
- SERP feature presence: Whether you own rich surfaces that shape attention before the click.
A brand can have strong rankings and weak recommendation visibility. That's why modern KPI design has to separate discoverability from selection.
One more rule matters here. Keep these KPIs aligned to business use. A dashboard packed with prompt-level noise becomes unreadable fast. If a metric doesn't help someone decide what to create, fix, defend, or prioritize, it doesn't belong in the main report.
Building Your Hybrid Report Template
The fastest way to ruin a keyword rankings and visibility report is to dump every export into one dashboard. The report needs structure before it needs charts.
Start with a reporting spine
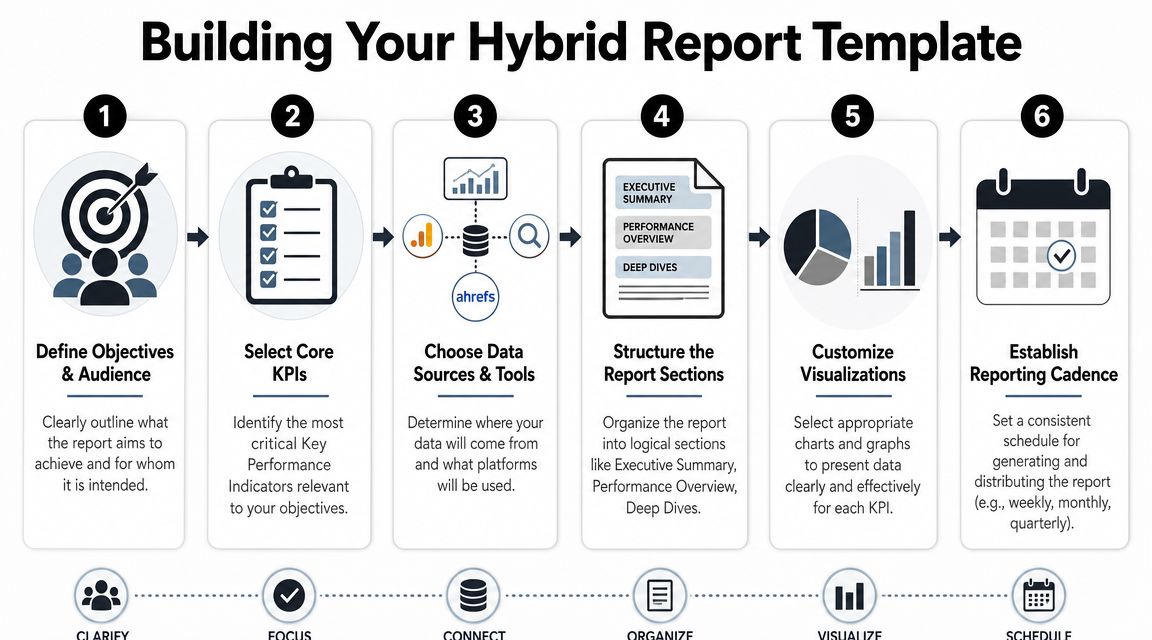
Build the report around a fixed set of dimensions. I recommend using these as the master keys across every data source:
- Keyword or prompt set
- Topic cluster
- Intent stage
- Geography
- Channel or surface
- Landing page or cited URL
- Competitor set
Once those are stable, you can pull data from tools without turning the report into a patchwork. For traditional SEO, it is common to source from Google Search Console, Google Analytics 4, Semrush, Ahrefs, Similarweb, or Advanced Web Ranking. For AI visibility, use a platform that can monitor prompts, mentions, citations, and competitive response patterns. One option is AI-powered SEO workflows and search monitoring, which shows how teams are pairing classic optimization with AI visibility tracking.
Your first worksheet or data table should not be a dashboard. It should be a clean fact table with one row per tracked entity, whether that entity is a keyword, prompt, or grouped concept.
Unify the data model before you visualize it
Most reporting problems come from mismatched naming.
If one tool labels a theme “customer support software,” another calls it “help desk,” and a third tags it as “service platform,” your rollups will be unreliable. Create a controlled taxonomy and force every source into it.
Use a simple mapping layer:
- Intent groups: Informational, comparative, transactional, navigational
- Page types: Homepage, feature page, solution page, blog, docs, pricing, comparison
- Markets: Country, region, city where relevant
- Visibility types: Blue link, SERP feature, AI mention, AI citation
Workflow note: Teams that standardize taxonomy early spend less time explaining reporting discrepancies later.
This is also the right place to define competitor logic. Don't compare every brand against every other brand. Create peer groups. One competitor set for enterprise deals may be useless for a local search cluster or an AI recommendation prompt.
If you're using Google Sheets, build separate tabs for raw imports, taxonomy mapping, normalized data, and executive output. If you're using Looker Studio, Power BI, or another BI layer, keep the same logic. Raw data should remain untouched. Transformations belong in a repeatable layer.
Design dashboard views people will actually use
The final report should have modules, not one giant canvas.
A practical layout often includes:
| Report Module | What it shows | Who uses it |
|---|---|---|
| Classic SEO Health | Ranking distribution, CTR, traffic trends, page-level winners and losses | SEO team, content team |
| AI Visibility and Reputation | Brand mentions, answer share, citation sources, competitor recommendation overlap | SEO, brand, PR |
| Competitive Landscape | Share of voice, topic ownership, geography gaps, overlap by intent | Leadership, strategy |
| Opportunity Queue | Pages to refresh, topics to expand, prompts to target, offsite sources to earn | Content, SEO, digital PR |
The visual rule is simple. Every chart should help answer one of three questions:
- Where did we lose ground?
- Why did it happen?
- What do we do next?
Avoid vanity visuals like blended average rank without segmentation. They look neat and explain almost nothing. Instead, show distribution charts, market comparison tables, intent-based filters, and page or citation drill-downs.
If you're building this for a multi-market team, include geography toggles from day one. If you're building it for a category with long buying cycles, include funnel-stage views. Those choices make the report operational instead of decorative.
Customizing the Report for Different Stakeholders
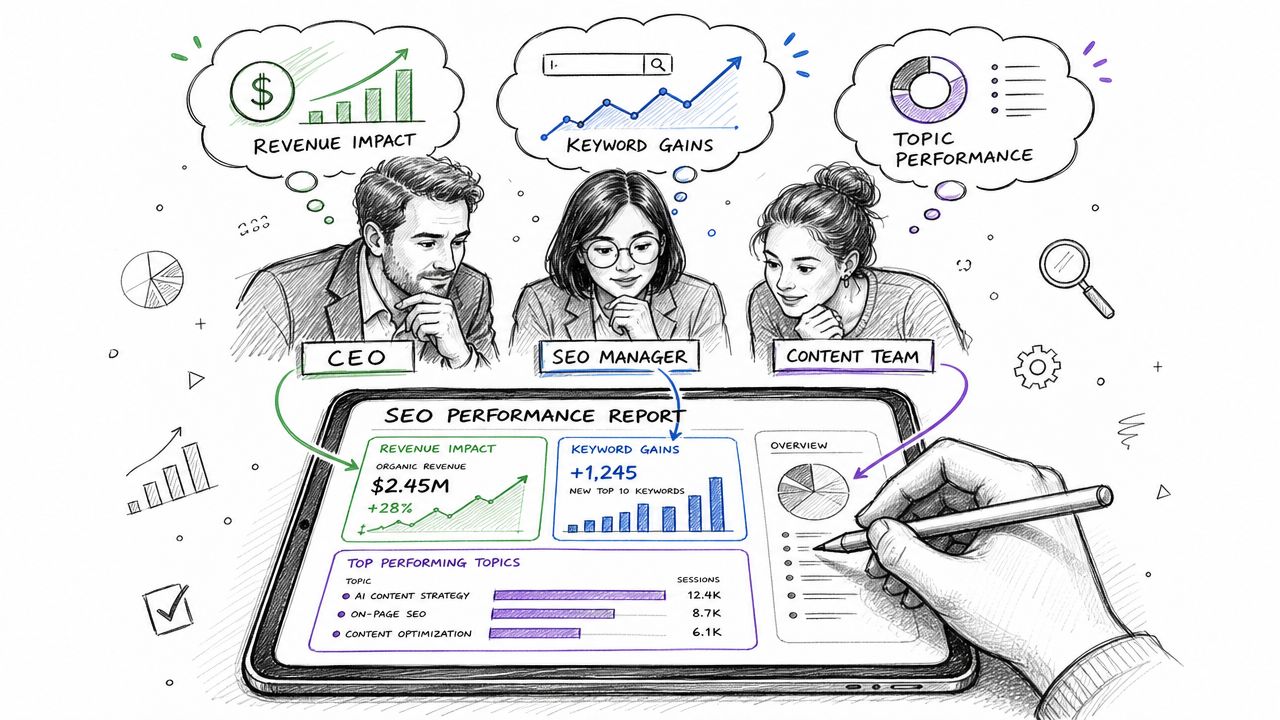
A master report is necessary. A single audience view is not.
What the executive team needs
An executive team rarely wants to inspect individual keyword movement. They want to know whether the brand is gaining or losing market presence in the areas that matter commercially.
Their version of the report should focus on:
- Competitive share view: Are core categories becoming easier or harder to own?
- Market-level movement: Which geographies are improving and which need intervention?
- Business-risk summary: Where visibility is slipping in high-intent topics or strategic product lines.
- Narrative shifts: Whether AI answers and search surfaces describe the brand accurately.
This view should fit on a small number of pages or dashboard tiles. The goal is decision support, not audit detail.
What content and SEO teams need
The working team needs the opposite. They need granularity.
For them, the best view usually includes prompt or keyword groups, landing pages tied to each group, ranking-band movement, citation patterns, and content gaps by topic cluster. The report should help them decide whether to refresh a page, publish a new asset, improve formatting for answer extraction, or build support content around a cluster.
A strong reference for simplifying these operational views is Keyword Kick's guide to client reports. It's written for client reporting, but the same discipline applies internally. Remove noise, keep decisions visible.
The right team view doesn't answer “How did SEO do?” It answers “What do we ship next?”
What PR and brand teams need
PR and brand teams need a narrative lens. They care less about average rank and more about how the company is represented.
Their cut of the report should isolate:
- Brand mentions in AI responses
- Citation sources shaping the narrative
- Competitor comparison prompts
- Topic areas where the brand is absent or misframed
- Geographic differences in brand description
In this context, a unified report becomes more than SEO reporting. It starts functioning as a search intelligence layer across owned, earned, and AI-generated surfaces.
The master dashboard stays the same underneath. What changes is the lens, the filtering, and the summary language.
Interpreting the Data and Taking Action
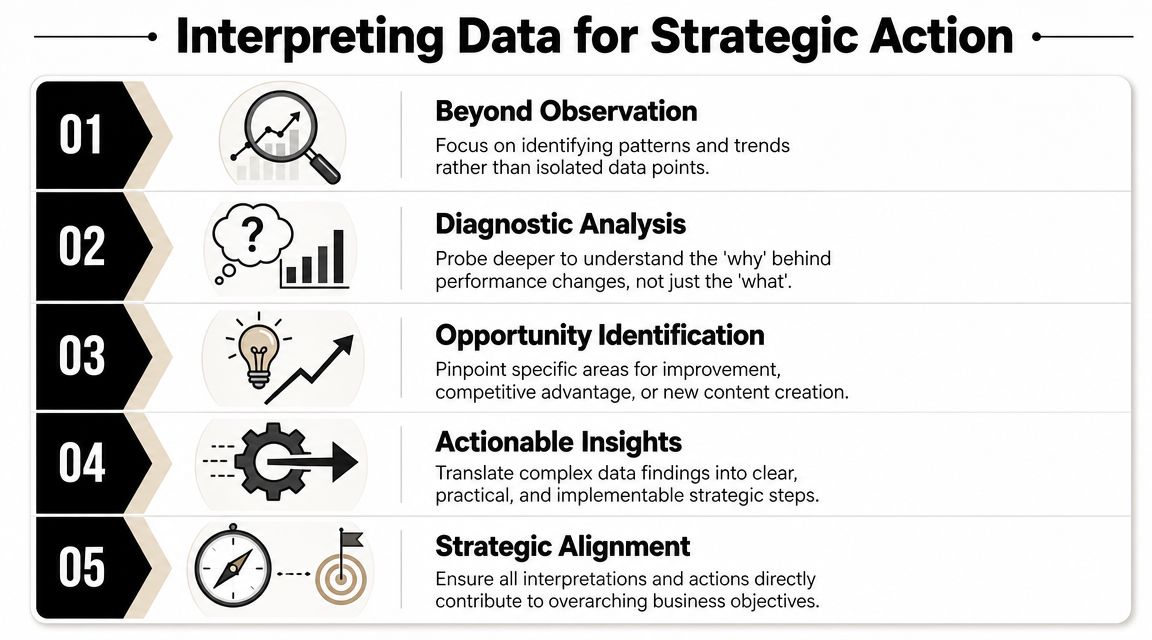
A report only becomes useful when the team can tell the difference between noise and signal.
A keyword rankings and visibility report works best when it tracks performance over time instead of reacting to single-day movement. One industry guide recommends evaluating aggregated impressions and ranking data across at least 4 to 6 weeks, noting that daily volatility can reach 30% for some keywords, which makes short-term swings unreliable for decision-making in SEO reporting trend-based keyword visibility reporting.
Read patterns, not isolated movements
If a single keyword falls for a day, that's monitoring. If a ranking band weakens across a topic cluster over several weeks, that's a pattern.
The report should train your team to interpret grouped changes:
- Stable traffic, weaker ranking distribution: You may be protected by branded demand or a few strong pages while broader discoverability erodes.
- Flat rankings, weaker AI mentions: Your pages still rank, but competing sources are being selected more often in answer environments.
- Improved visibility, weak engagement: You're appearing more often, but not for the right prompts, geographies, or stages of intent.
- Strong informational growth, weak commercial presence: Content production is working, but revenue-oriented surfaces remain underdeveloped.
A good analyst doesn't ask whether one metric moved. They ask which metrics moved together.
Use signal combinations to choose the next move
Treat interpretation as a decision matrix. Here are practical examples.
| If you see this | It usually suggests | Action to take |
|---|---|---|
| Keywords hold position but SERP feature visibility drops | You're still indexed well, but you're losing attention share | Rework formatting, improve extractable answers, strengthen structured page sections |
| AI mentions rise but cited URLs are weak or off-message | Models are finding you, but not through the pages you want | Build or refresh canonical pages for the topic and tighten internal linking |
| Commercial prompts show competitor dominance | The market sees them as the safer choice in buying contexts | Audit their cited content, comparison pages, proof elements, and offsite validation |
| One geography underperforms while others stay steady | Local relevance or regional authority is weaker | Localize pages, review market-specific proof, align citations and local intent coverage |
| Topic cluster is visible but conversion pages are absent | You own education, not selection | Add solution, use-case, pricing, and comparison content tied to the cluster |
Don't ask whether the report says performance is up or down. Ask what the report is telling your team to build, fix, defend, or stop doing.
This is the shift from reporting to intelligence. The report isn't the output. The next action is.
Automating and Distributing Your Report
Manual reporting breaks the moment you add multiple countries, prompt sets, competitors, and channels. The fix isn't just automation. It's disciplined cadence.
Set different cadences for different signals
Not every metric deserves the same schedule.
Brand-sensitive prompts, competitor mentions, and narrative issues should be monitored frequently because teams may need to respond quickly. Broader cluster-level visibility trends usually work better in a slower review cycle because they need context, not panic.
A sustainable operating model usually includes:
- Frequent monitoring: Critical brand prompts, executive-risk topics, major competitor comparisons
- Regular performance review: Topic clusters, page-group trends, geography changes
- Strategic review: Market positioning, content roadmap shifts, cross-channel visibility gaps
For tooling, use APIs where possible, scheduled exports where necessary, and one destination for normalization. If you're evaluating platforms for the AI side, this roundup of AI search monitoring tools for tracking brand visibility is a practical starting point. Spotlight Group LLC is one option in this category. It tracks brand mentions, prompts, citations, competitors, and geo-specific results across major AI search platforms.
Distribute insight, not dashboards
Most dashboards are over-shared and under-read.
Executives need a summary. SEO teams need drill-down access. PR needs narrative alerts. Product marketing may only need visibility shifts for strategic categories. Set delivery based on use case, not habit.
Useful distribution patterns include:
- Email summaries: Short takeaways with links to the live dashboard
- Slack alerts: Triggered for major brand, competitor, or citation changes
- Live BI access: Reserved for teams that actively work in the data
- Monthly review decks: Built from the same reporting source, not recreated manually
There's also a lesson from adjacent monitoring disciplines. Teams that combine search reporting with broader market listening tend to spot context faster. For example, social listening with Instagram location data shows how location-aware signals can sharpen local market interpretation. The same principle applies here. Geography is often where visibility shifts become actionable first.
Frequently Asked Questions
How do you report on prompts that don't have clear search volume
Treat them as part of a topic cluster instead of forcing a false precision model.
AI discovery doesn't always map neatly to traditional keyword volume. The better method is to group prompts by job to be done, intent, and business priority, then track whether your brand appears consistently across the cluster. That gives you directional intelligence without pretending every prompt behaves like a classic search term.
What counts as a good visibility score
There isn't a universal number that matters across every category.
A useful benchmark is relative. Compare your visibility against direct competitors in the prompts, topics, and geographies that affect pipeline. Then track internal improvement over time. A score is only meaningful if it helps you judge whether your presence is strengthening in the right places.
Can you build this manually
Yes, but only to a point.
You can combine Google Search Console, GA4, rank tracking exports, spreadsheets, and periodic prompt testing. That works for a small footprint. It usually breaks when you add multi-market monitoring, recurring competitor comparison, citation analysis, and stakeholder-specific views.
Manual spot checks also create consistency problems. One person asks a slightly different prompt, from a different location, on a different day, and the result looks like a strategic change when it isn't. That's why repeatable monitoring matters more than clever screenshots.
Should AI visibility replace traditional SEO reporting
No. It should sit beside it.
The strongest reporting model is hybrid. Traditional SEO still tells you whether your pages are discoverable and competitive in search results. AI visibility tells you whether your brand is being selected, cited, and described in answer environments. You need both views to understand the full path from discovery to decision.
What's the biggest mistake teams make with this report
They overload it with metrics and underinvest in diagnosis.
If the dashboard can't tell a team where visibility changed, why it likely changed, and what action to take next, it's just a prettier spreadsheet.
Spotlight Group LLC helps teams monitor brand visibility across AI search and conversational platforms, including mentions, prompts, citation sources, competitive comparisons, and geo-specific results. If you're updating your keyword rankings and visibility report for AI search, Spotlight Group LLC is worth evaluating alongside your existing SEO and BI stack.

Michael Hermon
Before Spotlight, Michael led Innovation and AI at monday.com after exiting his previous startup. He learned to code at 13 at MIT and later attended Columbia’s MBA program.
https://linkedin.com/in/michaelhermon